Visualize data
Visualize data
-
QuickSight will attempt to load your data to SPICE, please wait for a few minutes.
-
To visualize the flow of yellow taxi trips from pickup borough to drop-off borough, click + Add in the menu.
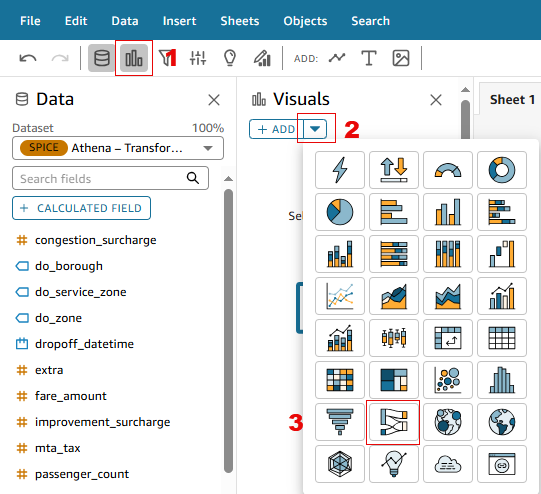
-
Select the Sankey visual type, specify the following on the Field wells.
- Source –
pu_borough - Destination –
do_borough - You can click on the visual type title, change it to Taxi Trips Flow
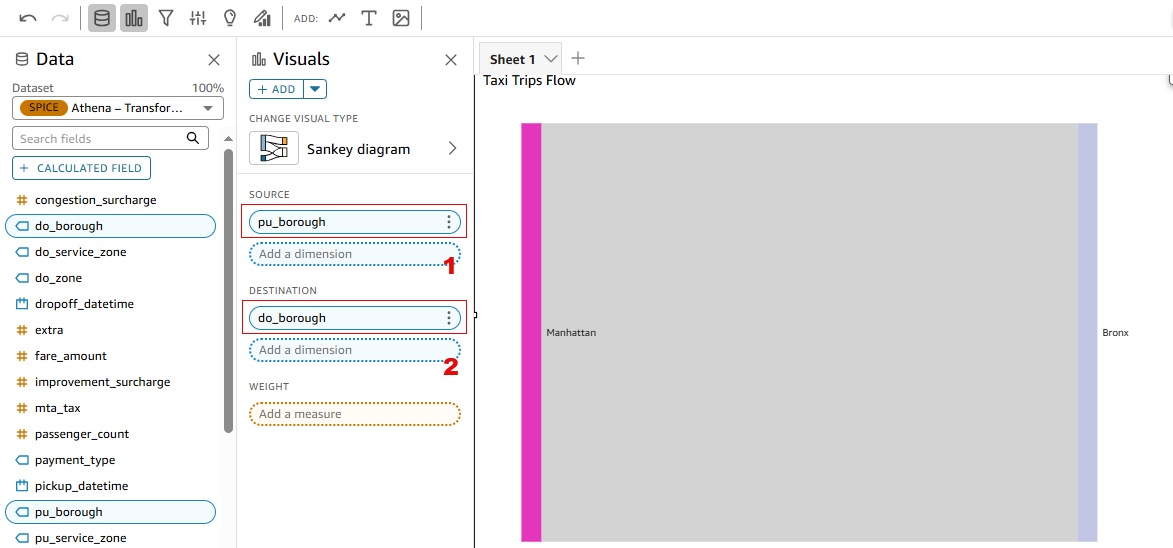
- Source –
Filtering Data
-
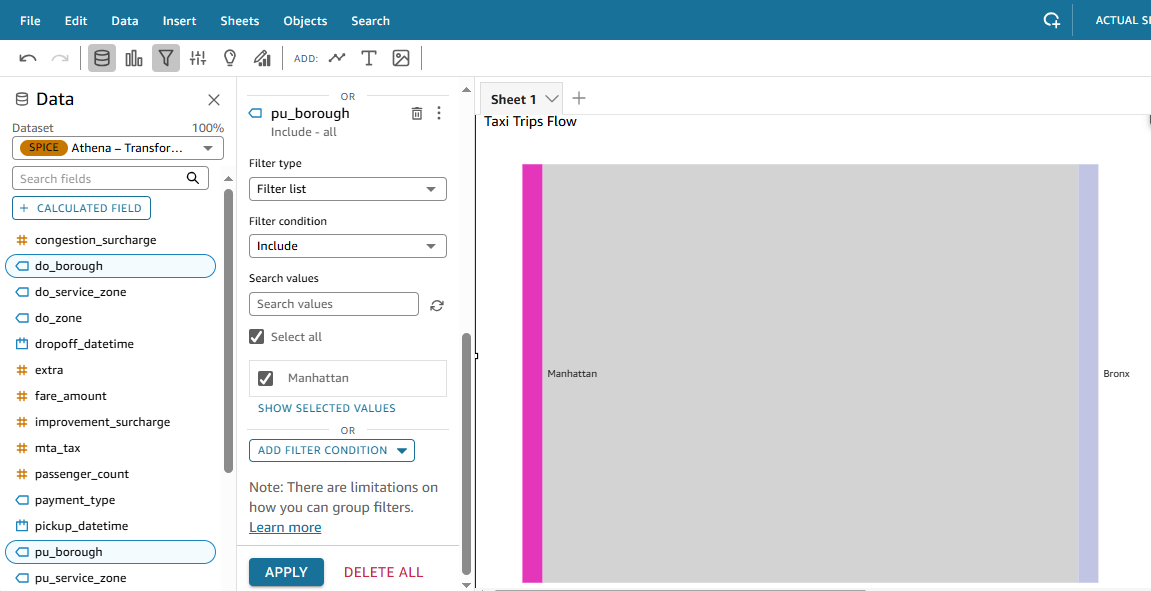
Create a filter focus on taxi trips originating from Manhattan.
-
Type
pu_boroughand then select it. -
Click on the menu besides the pu_borough filter, select Edit.
-
Deselect Manhattan from the Filter list, click Apply.
-
Get insights by examining the taxi trip flow based on pickup borough and drop-off borough.
-
Observe the traffic flow patterns.