Visualizing Data
Overview
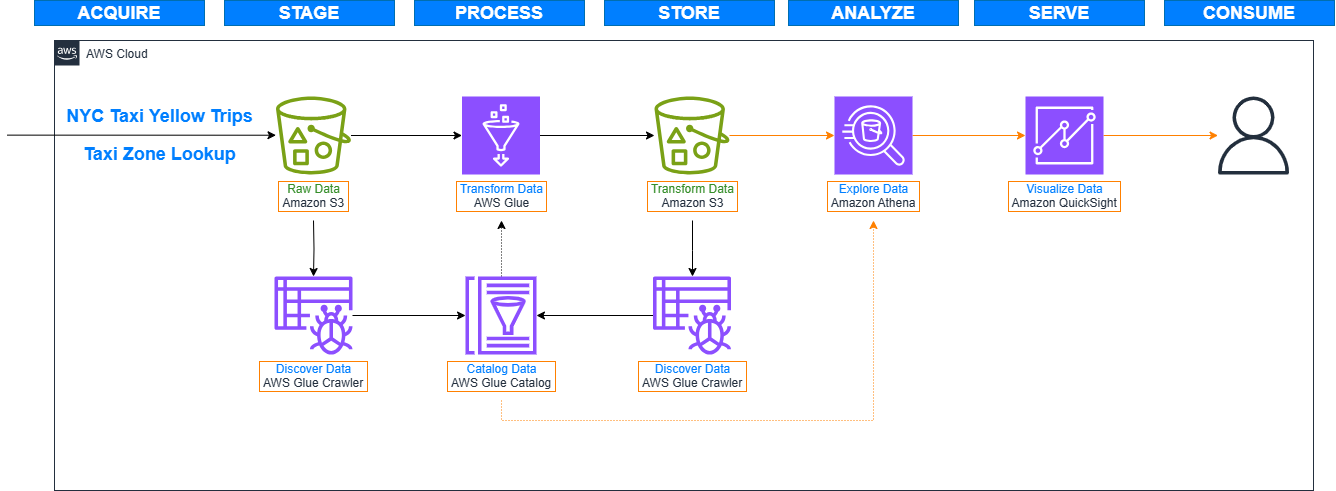
In this lab, we will create access the enriched data that is stored in Amazon S3 and then visualize the data in Amazon QuickSight. We will get insights on the flow yellow taxi trips from the pickup borough to the drop-off borough.